
MasterVision: Publisher dashboards done right
Empower your sales & marketing teams with instant insights.
Retain existing customers. Drive new sales.
Save time & money.
Publisher benefits
Can you do all this at the click of a button?
-
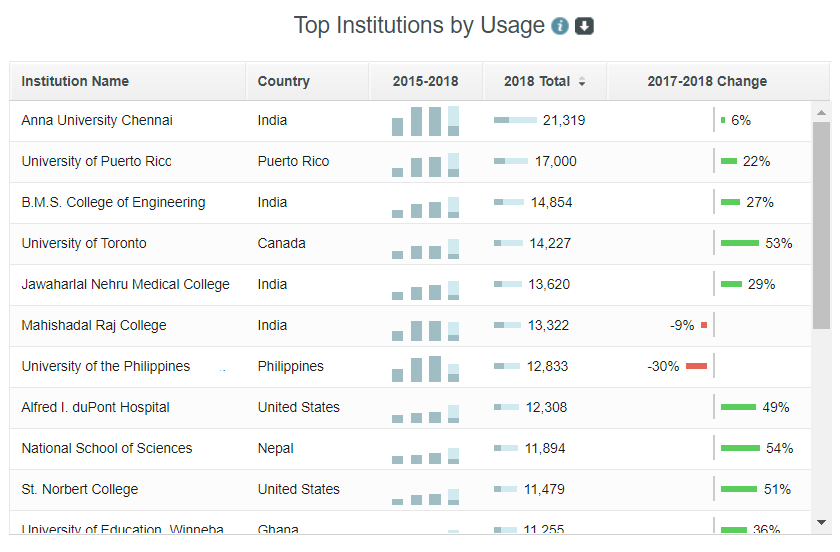
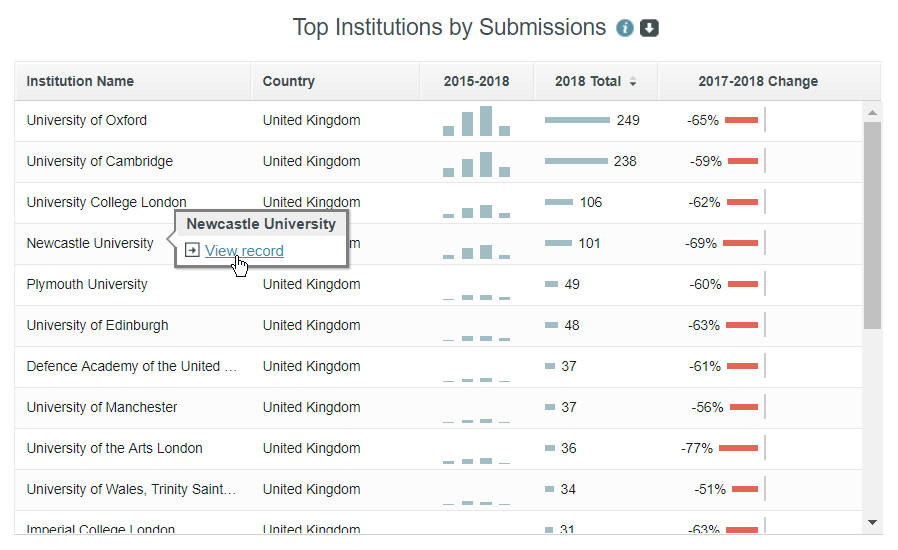
Rank top institutions by submissions, spend, usage, denials, pay per view & more
-
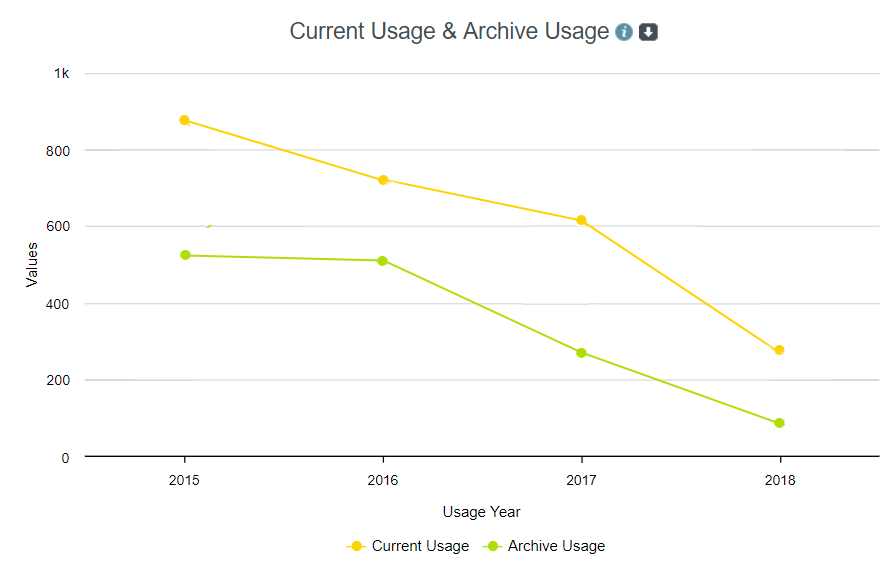
Identify 'at risk' institutions with low or declining usage / high cost per download
-
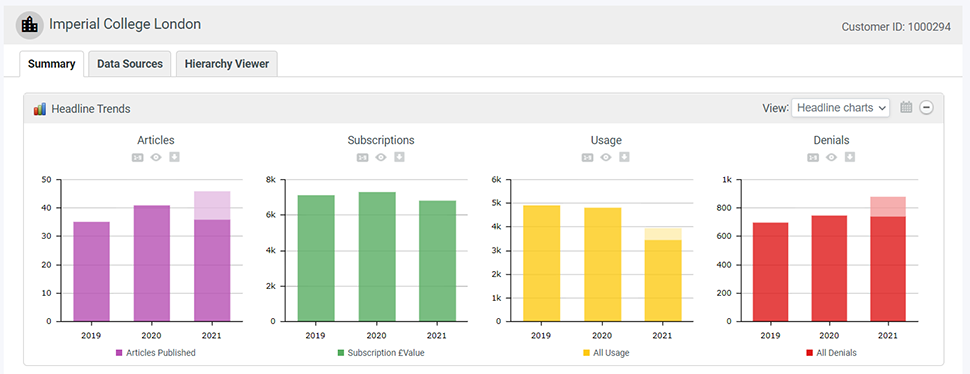
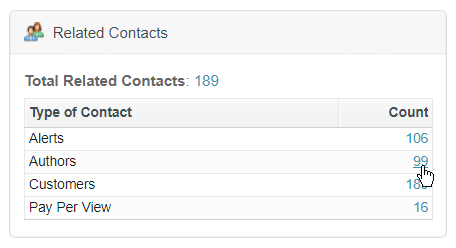
View a complete 360° profile of any given customer
-
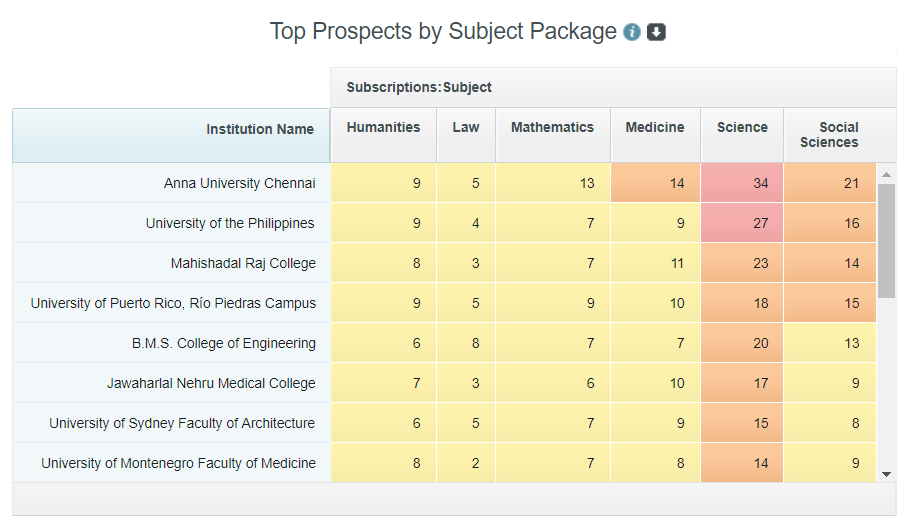
Find new prospect institutions with high author submissions but no subscriptions
-
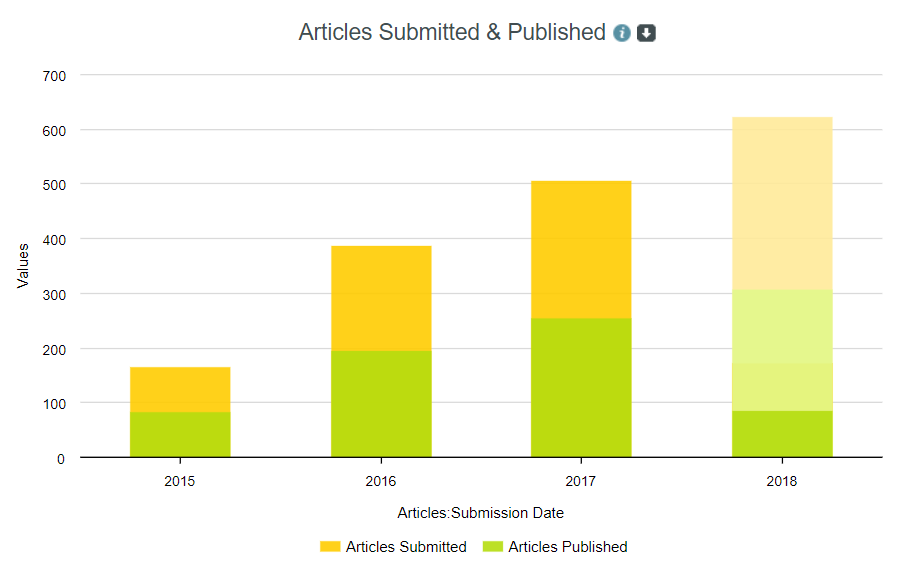
Target authors at subscribing institutions to solicit more quality article submissions
-
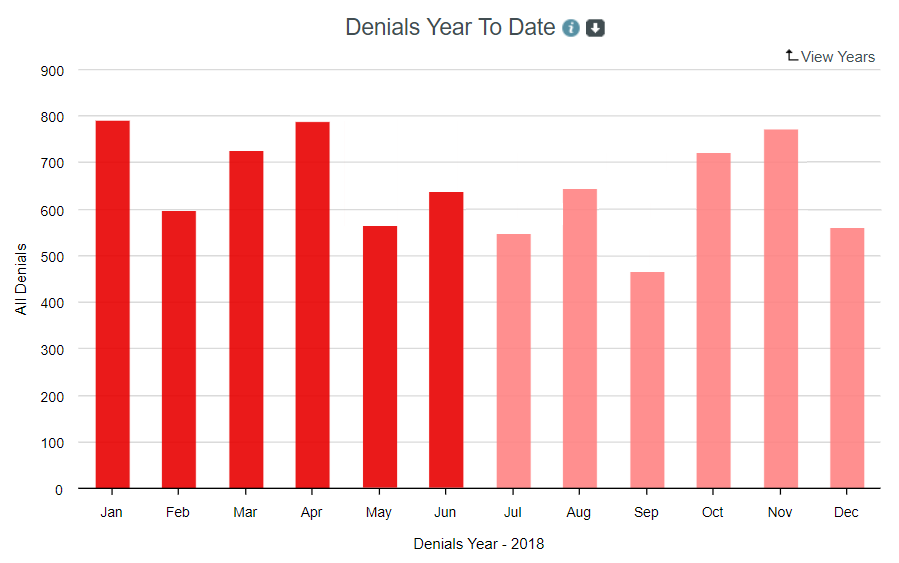
Find new prospect institutions with significant numbers of access denials
-
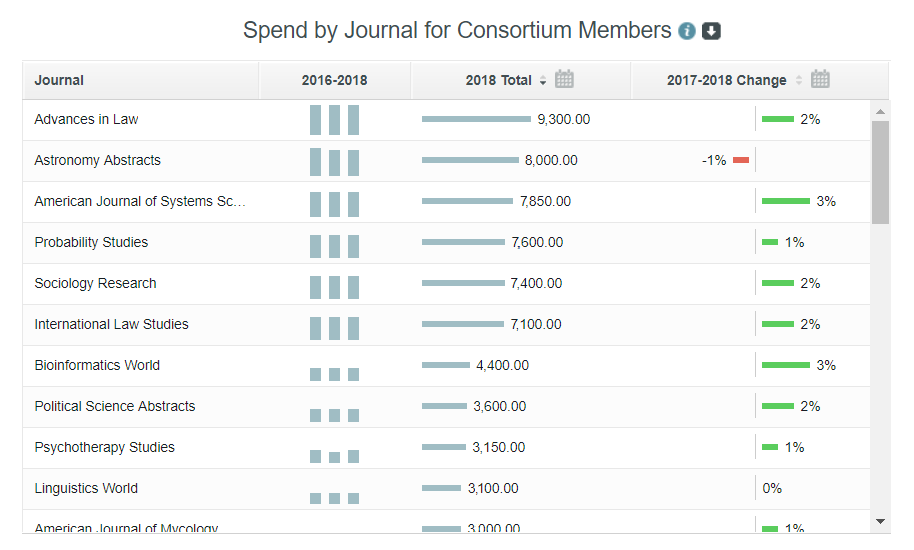
Cost potential new consortia deals by reporting existing holdings of member institutions
-
Identify package upsell opportunities based on current subscription holdings
-
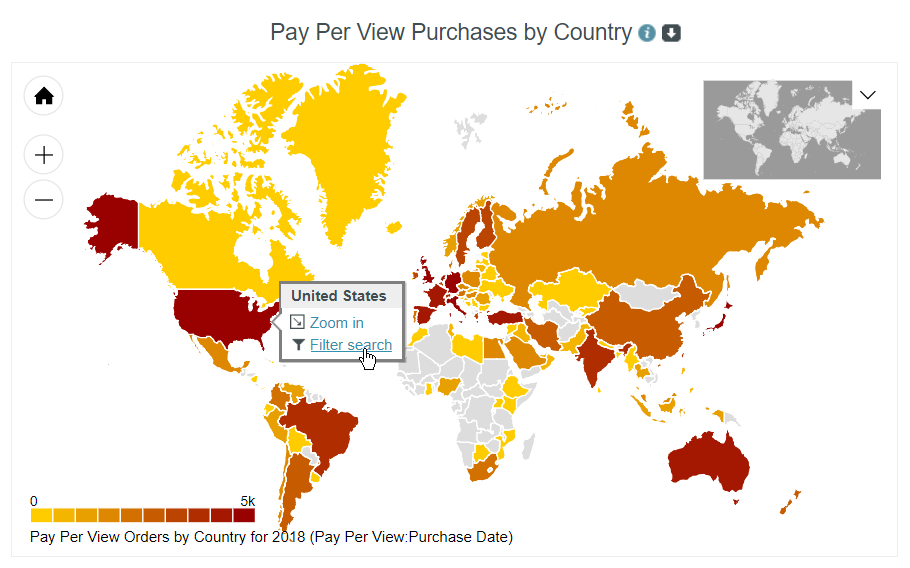
Find new prospects with high numbers of single article purchases
-
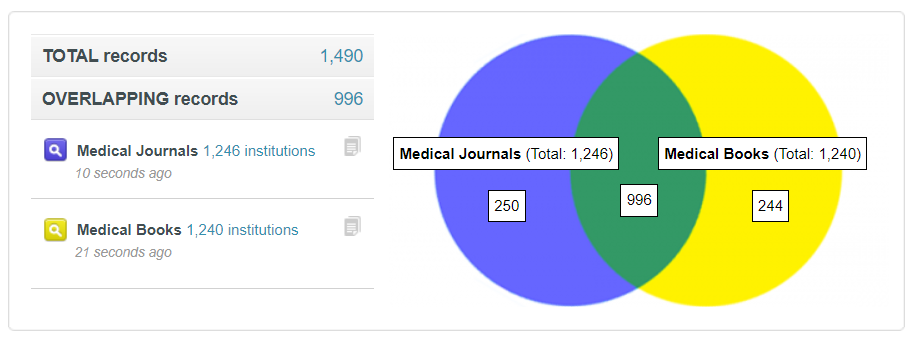
Cross-refer book sales & journal subscriptions to target new sales opportunities
Dashboard features
-
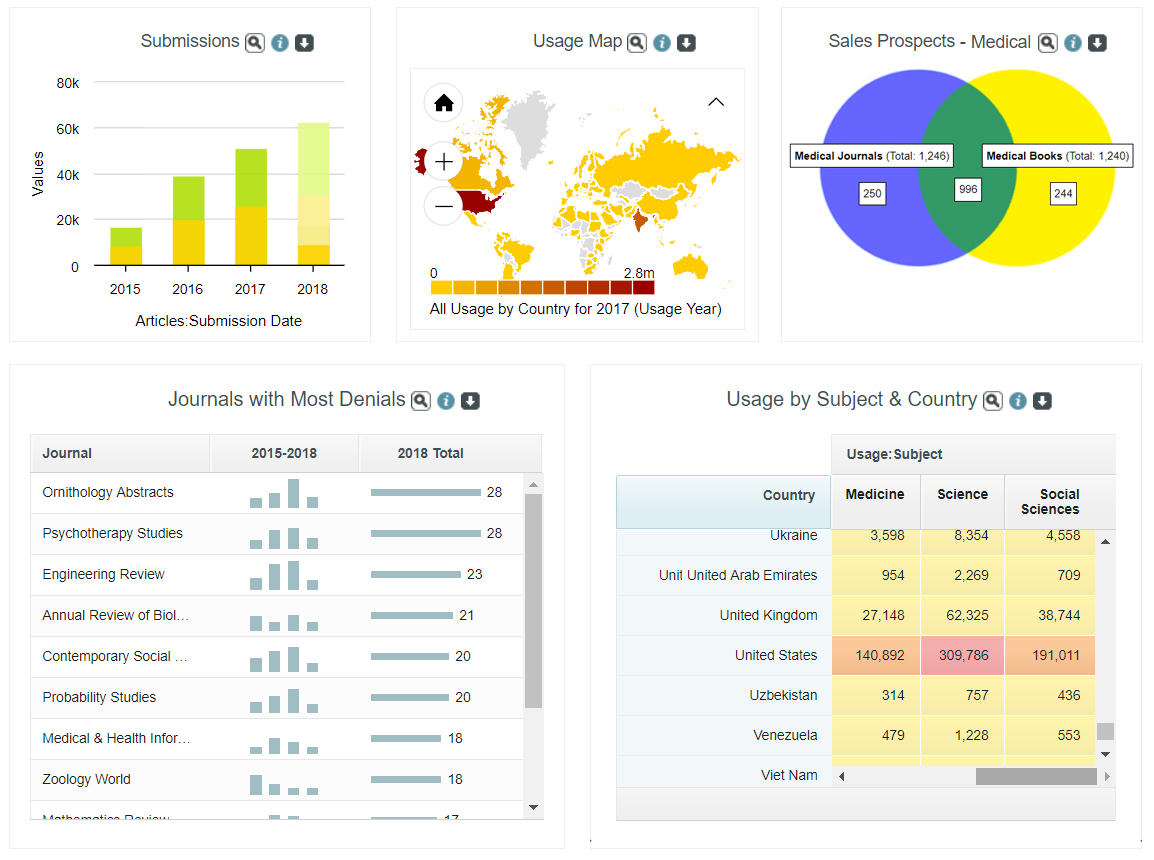
Bring your data to life with interactive charts, maps, tables, cross tabs & Venn diagrams
-
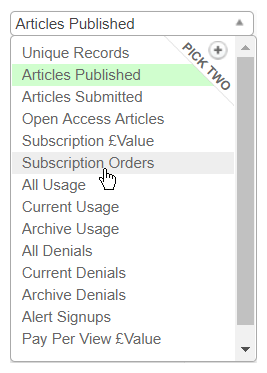
Analyse by submissions, spend, usage, denials, pay per view & more
-
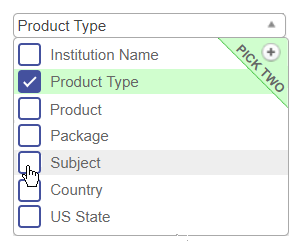
Filter by customer, product type, product, package, subject, country, territory, etc.
-
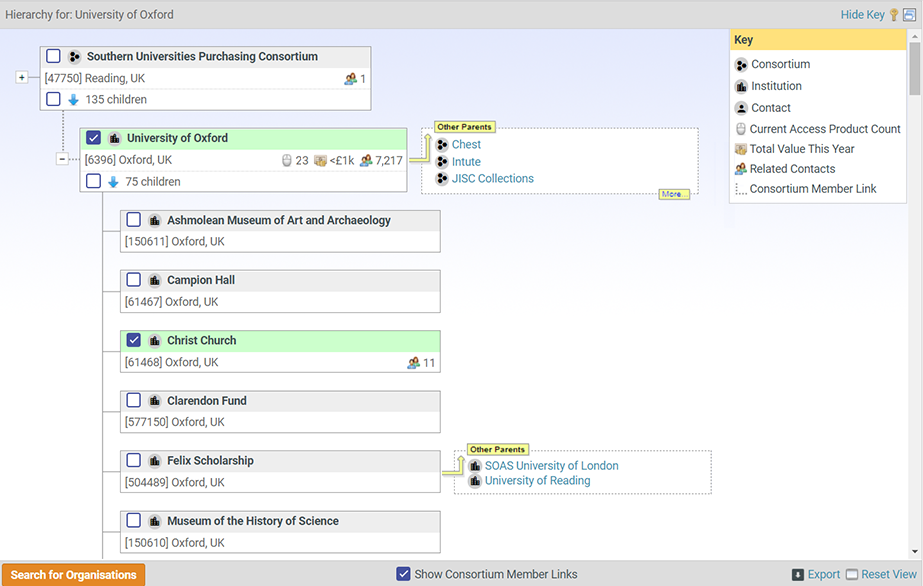
Explore relationships between organizations using an interactive 'family tree' view
-
Run analysis across all customers, or zoom in to view full details for any single customer
-
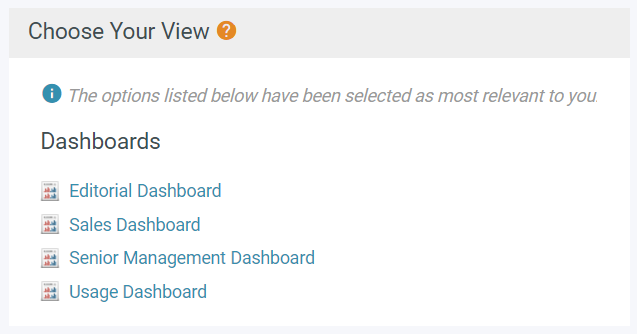
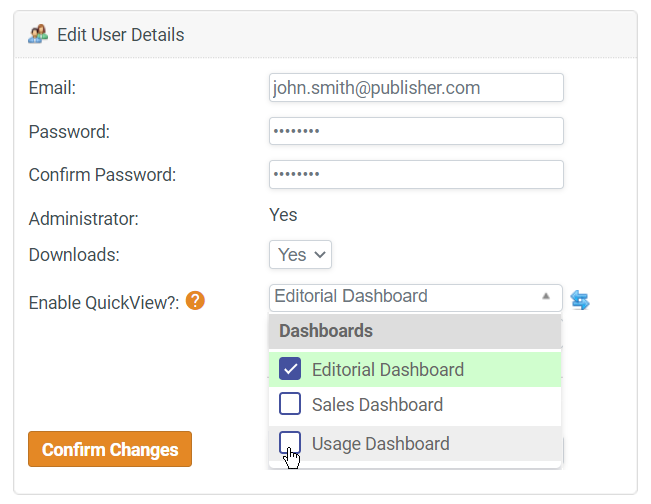
Design as many custom dashboards as you need - not just 'canned reports'
-
Easily save, download & share - assign different dashboard views to different colleagues
-
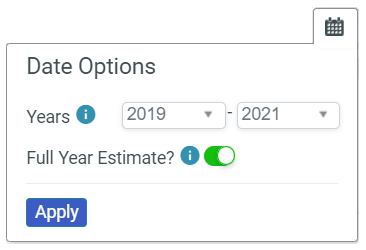
Compare year-on-year, including accurate full-year estimates for current year-in-progress
-
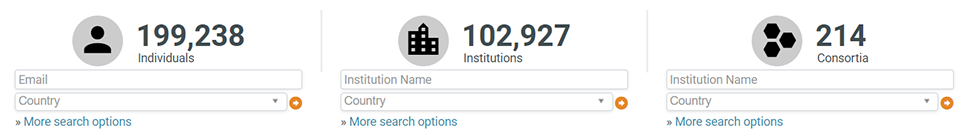
Seamlessly integrate institutional, individual & consortia customers
-
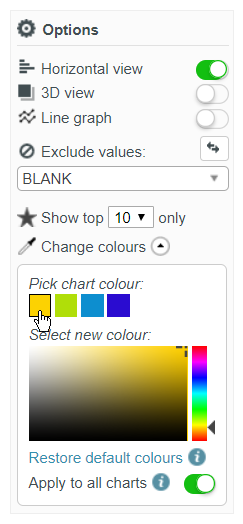
Fully configurable: you can control chart style, size, colours, headings, notes & more
Why choose MasterVision?
- Industry expertise: fully tailored specifically for the scholarly publishing industry
- Enhance your data: we always include full integration with Ringgold or ROR as standard
- Simple to set up, simple to use: including expert support & training at no additional cost
- Not just usage: see the complete picture, including authors & submissions, subscriptions, usage & denials, consortia deals, pay per view, e-alerts & more
- Not just journals: we also handle books, e-books & database products
- Not just institutions: bring individual customers, authors & members into the picture
- Not just dashboards: drill right down to explore row-by-row detail for every customer
- You're in good company: many of the world's biggest publishers rely on DataSalon...
Frequently asked questions
-
Which data sources are required for the dashboard? + –You can choose to include as many or as few sources as you like, and it's no problem to leave out sources which may be unavailable for whatever reason. Of course, a wider range of data sources will mean more dashboard functionality. We already handle a huge range of data for over 20 different publishers worldwide, including subscriptions, sales, usage, denials, author submissions, members, pay per view purchases, e-alert signups & more.
-
How is data loaded into the dashboard? + –We strive to make it as easy as possible to supply data, and we'll handle the entire loading & linking process for you. We can collect COUNTER usage reports via SUSHI & author/submissions data from the ScholarOne API. We also handle lots of data supplied as plain old CSV files or Excel spreadsheets. We already process data from over 20 different publishers hosting with Atypon, HighWire, Silverchair & Ingenta, so rest assured we'll be able to get your data loaded up.
-
Which types of publisher do you work with? + –We work primarily with academic journal / book / database publishers. Please feel free to get in touch to discuss your particular requirements. We work with publisher data relating to journals, books, e-books, databases, or any combination of those. You certainly don't need to include all of those different content types to create really insightful dashboards.
-
How is the source data cleaned & linked? + –We'll take care of linking everything together, and we don't require publishers to supply 'polished' data. Every setup includes - as standard - full integration with either Ringgold or ROR to help to clean & dedupe your institutional data. And if you also choose to include individual contacts (e.g. authors, customers, members) we can automatically connect those up to their parent institutions too.
-
Is there anything to install? + –No. The service is fully web-based, and works with all modern browsers on PC, Mac & iPad.
-
How much does it cost? + –The service is competitively priced, depending on the volume of source data going into the dashboards. There are no limits on how many of your staff can use the service, and we don't apply "per seat" pricing. Please get in touch to request a quote.
-
How long does it take to set up? + –Once we have access to all of the relevant source data, setup is usually completed within a matter of weeks.
-
Which types of users is it designed for? + –The dashboards are designed to be as user-friendly as possible for all types of staff - including sales, marketing, editorial etc. - and not just 'technical' users.
-
Are there limits on users? + –No. There are no limits on how many of your staff can use the service. We do NOT apply the dreaded "per seat" pricing.
-
What training & support is provided? + –Every setup includes half a day of expert training, which we'll tailor to your specific requirements. Ongoing email support is provided as standard, and we'll keep in regular contact to help ensure you get the most of the service.
-
What about data security? + –We are a GDPR-compliant data processor, and have best-practice data security measures in place. Our security policies have been reviewed & approved by many of the world's largest scholarly publishers.